From Binomial Distribution to Confidence Intervals: How to Judge if Your Gaming Drought is Statistically Abnormal
Every gamer knows the frustration: 200 runs without that legendary drop rate item, 500 gacha pulls with no 5-star, endless farming with zero uber unique drops. But is your drought just bad RNG, or statistically impossible? This comprehensive guide reveals how to use binomial probability distribution, confidence interval calculations, and drop rate calculator tools to scientifically determine when bad luck crosses into anomalous territory—essential knowledge for Diablo 4, Path of Exile, Genshin Impact, Lost Ark honing calculator analysis, and any loot-based game.

The question haunts every loot farmer: "Am I just unlucky, or is something broken?" When you've run 300 Diablo 4 mythic drop rate attempts without success, opened 600 Borderlands 3 legendary drop rate calculator chests with nothing, or hit 800 Genshin Impact pity calculator pulls approaching hard pity—you need mathematical certainty, not gut feeling. At LootCalc, we apply binomial probability distribution theory and confidence interval statistics to transform your farming data into definitive answers. This guide explains exactly how to calculate drought probability, interpret confidence intervals, and determine when your RNG is statistically abnormal using our drop rate calculator tools and proven probability methodology.
Drought Analysis Quick Reference: Binomial Probability & Confidence Intervals
Understanding Binomial Probability Distribution in Gaming Loot Systems
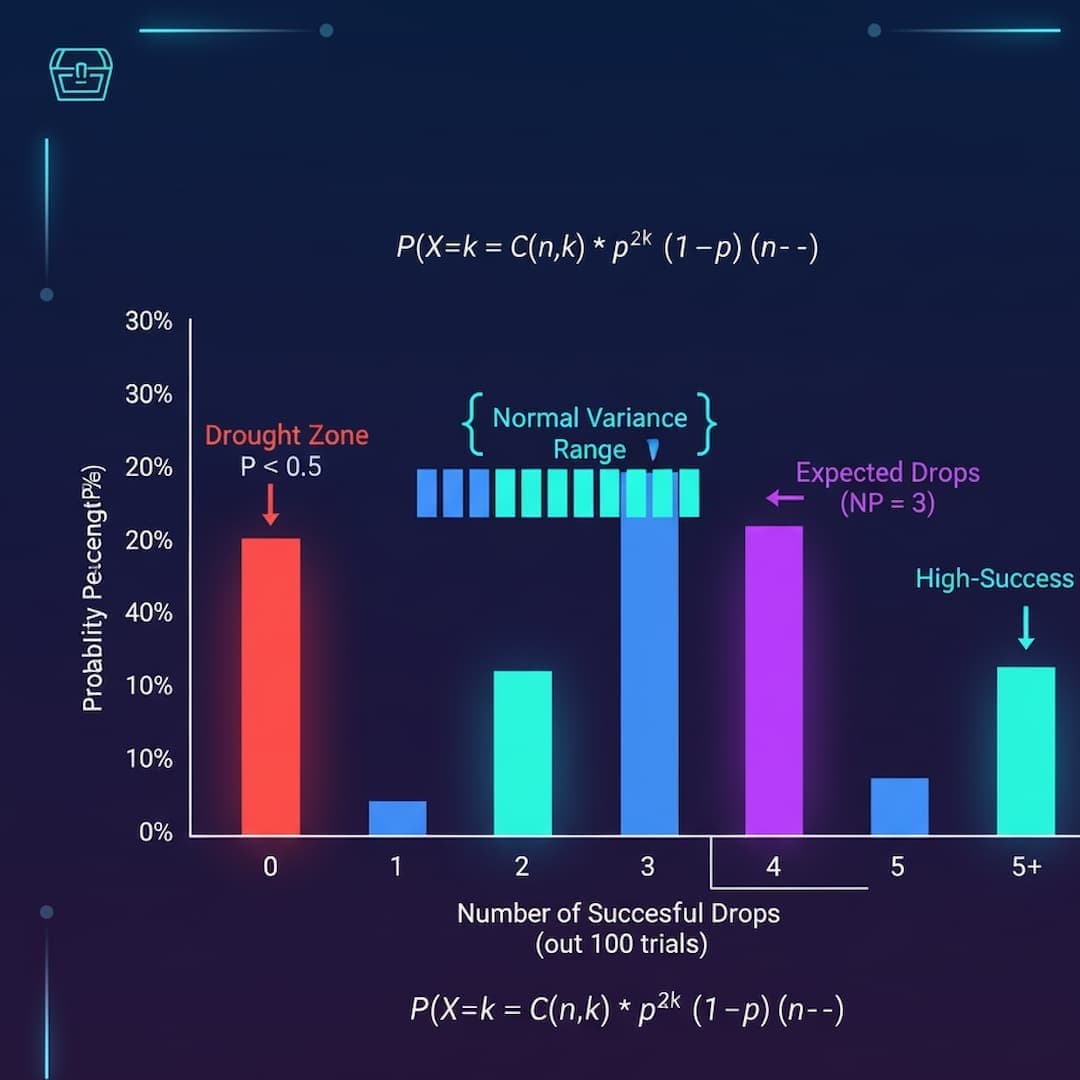
Every loot drop calculator, gacha probability calculator, and drop rate calculator tool relies on the binomial distribution—the foundational probability model for repeated independent trials with binary outcomes (success/failure, drop/no-drop, legendary/common). Whether you're analyzing Diablo 4 unique drop rate calculator results, Path of Exile currency drop calculator farming sessions, or Genshin Impact wish pity calculator gacha pulls, binomial math governs the probability of getting exactly k successes in n attempts.
→ Binomial Distribution Formula: Drop Rate Probability Calculator Foundation
Mathematical Binomial Probability Formula for Gaming Drops
- •X: Random variable representing number of successful drops
- •k: Exact number of successes you want to calculate probability for (0, 1, 2, 3...)
- •n: Total number of independent trials (farming runs, gacha pulls, boss kills)
- •p: Drop rate probability per trial (0.01 for 1%, 0.018 for 1.8%, etc.)
- •C(n,k): Binomial coefficient = n! / (k! × (n-k)!) — number of ways to arrange k successes
Practical Binomial Example: Diablo 4 Uber Unique Drop Rate Calculator
Consider farming Diablo 4 uber unique calculator items with a 0.2% (1 in 500) drop rate. You've completed 300 boss kills with zero drops. What's the probability of this drought?
Step-by-Step Drought Probability Calculation Using Binomial Distribution
Result: A 300-run drought has 54.88% probability—this is completely normal RNG, not abnormal. More than half of all players farming this drop will experience 300+ dry runs. Your drought isn't statistically unusual yet. Use our Diablo 4 loot calculator to model your specific scenario.
When Does a Drought Become Statistically Abnormal? P-Value Thresholds
In statistics, p < 0.05 (5% probability) is the standard threshold for "statistically significant" or abnormal. For drought analysis: if P(getting zero drops in n trials) < 5%, your drought is statistically unusual. This doesn't prove anything is broken—5% events happen 1 in 20 times by pure chance—but it signals "investigate further." Let's calculate when 0.2% drop drought crosses into abnormal territory.
Finding the Abnormal Drought Threshold: Solving for Critical n
For a 0.2% drop rate, droughts become statistically abnormal (p < 0.05) after approximately 1,498 consecutive failures. At 300 runs, you're nowhere near abnormal. At 1,500+ runs with zero drops, it's time to verify drop rates, check if you're farming the correct content, or suspect game bugs. Use our game loot calculator API tools to calculate thresholds for your specific drop rates.
→ Practical Applications: Binomial Probability Drop Calculator for Every Game
Binomial distribution applies universally across gaming loot systems. Here's how to use it with popular loot calculator tools:
- Genshin Impact Pity Calculator: Calculate probability of hitting soft pity (75 pulls) vs hard pity (90 pulls) using binomial cumulative distribution. Our gacha probability calculator models exact pity system math.
- Lost Ark Honing Calculator Probability: Binomial distribution determines likelihood of consecutive honing failures. With 10% success rate, P(failing 20 times) = (0.9)^20 = 12.16%—frustrating but not abnormal.
- Path of Exile Currency Drop Calculator: Model Divine Orb drought probability across map farming sessions. See our POE currency calculator profit tools.
- Destiny 2 Raid Exotic Drop Rate Calculator: Calculate Vex Mythoclast or Eyes of Tomorrow drought probability. Use our raid loot drop calculator for precise modeling.
- Warframe Relic Drop Chance Calculator: Binomial math determines radiant relic farming efficiency and drought likelihood across void fissure runs.
Confidence Intervals: Verifying Advertised Drop Rates with Drop Rate Calculator Tools
Confidence intervals answer a different question than binomial probability: "Based on my observed drops, what's the likely true drop rate range?" If a developer claims 1% drop rate, but you got 2 drops in 1,000 trials (0.2% observed), is the advertised rate wrong—or just variance? Drop rate confidence interval calculators provide statistical bounds, essential for gacha rate calculator verification, loot box odds calculator audits, and community-driven drop rate research.
→ Confidence Interval Formula: Wilson Score Method for Drop Rate Estimation
Wilson Score Confidence Interval (95% Confidence Level)
- •p̂: Observed drop rate (successes / trials) — your sample proportion
- •n: Total number of trials (farming runs, pulls, attempts)
- •z: Z-score for confidence level (1.96 for 95% confidence, 2.576 for 99% confidence)
- •CI: Range [lower bound, upper bound] containing true drop rate with 95% confidence
Practical Confidence Interval Example: Gacha Pull Simulator with Rates Verification
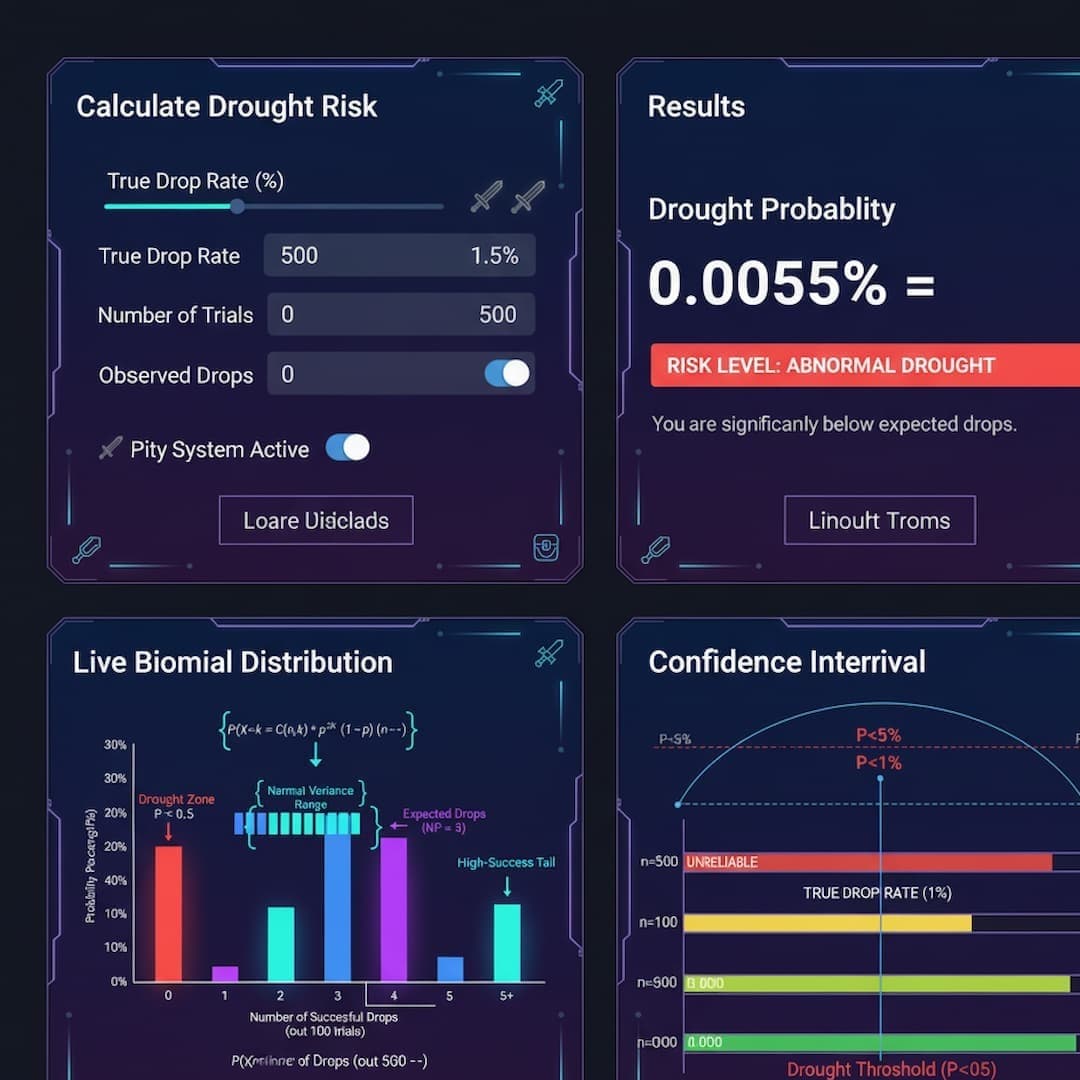
Suppose a gacha game pull calculator advertises 1.5% SSR rate. You pull 500 times, getting 4 SSRs (0.8% observed rate). Is the advertised rate accurate? Let's calculate the 95% confidence interval.
Step-by-Step Gacha Rate Confidence Interval Calculation
Interpretation: The true drop rate is likely between 0.31% and 2.04% with 95% confidence. The advertised 1.5% falls within this interval—meaning your observed 0.8% is consistent with the advertised rate (just bad luck from small sample size). If the advertised rate were 3%, it would fall outside the confidence interval, suggesting either incorrect advertised rates or anomalous results. Use our gacha calculator with pity for comprehensive analysis.
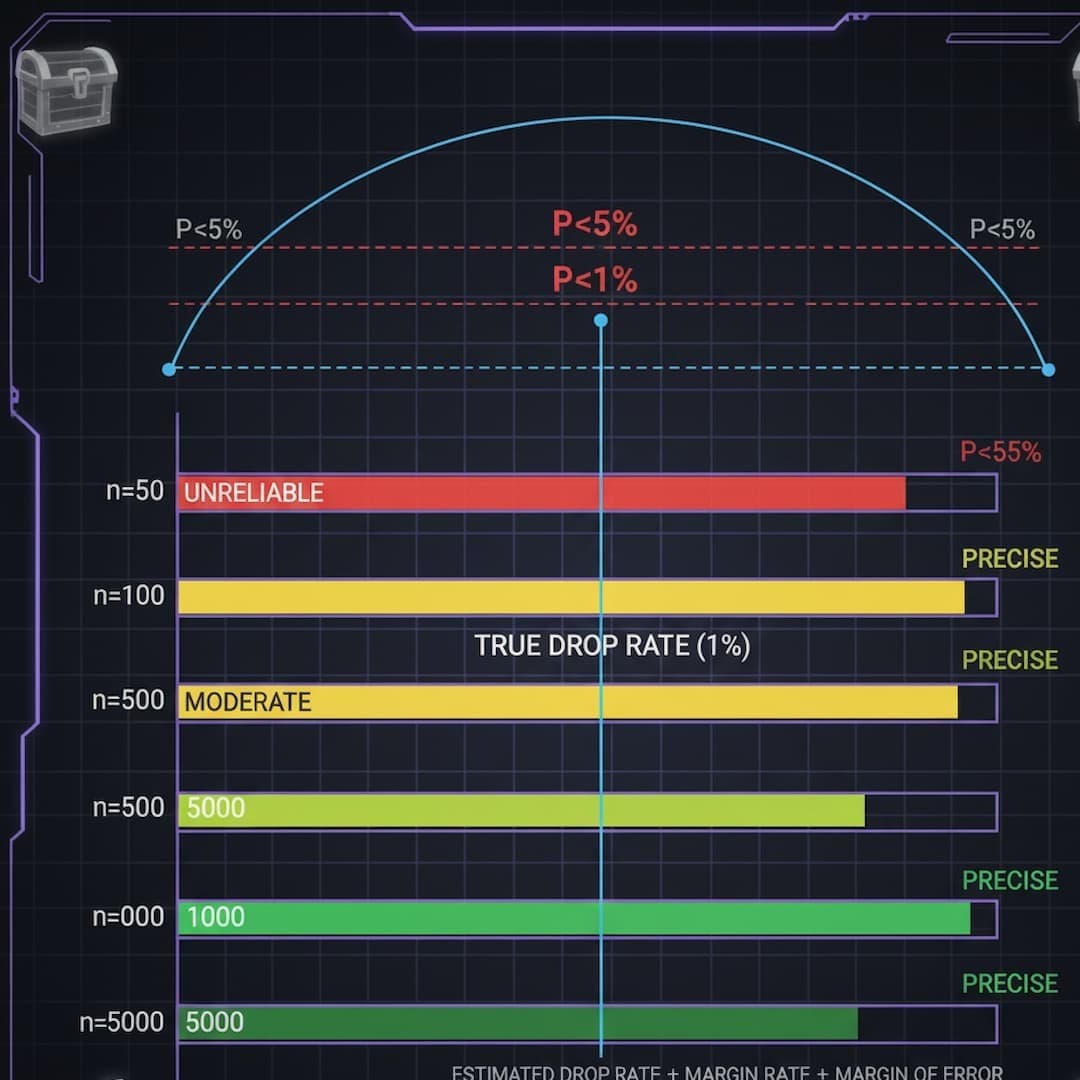
Sample Size Requirements: How Many Trials for Accurate Drop Rate Estimation?
Confidence interval width depends on sample size. Small samples (n=50) produce wide intervals (useless for verification). Large samples (n=10,000) produce narrow intervals (precise estimates). Here's the required sample size formula for desired precision:
Required Sample Size for ±E Margin of Error
- •E: Desired margin of error (e.g., 0.005 for ±0.5% precision)
- •p: Expected drop rate (use 0.5 if unknown — worst case, largest sample needed)
- •z: Z-score (1.96 for 95% confidence)
Sample Size Examples for Common Drop Rates
To estimate a 1% drop rate with ±0.2% precision (95% confidence): n = (1.96² × 0.01 × 0.99) / 0.002² = 9,509 trials minimum. For 0.1% drop rate with ±0.05% precision: n = 15,340 trials. Community-driven drop rate research requires massive datasets—individual players rarely have sufficient samples for narrow confidence intervals. Our drop math guide explains sample size calculations in detail.
→ Confidence Interval Applications: Drop Rate Calculator Gaming Probability Tool
Advanced probability calculator for gaming drops tools integrate confidence intervals for multiple use cases:
- Verifying Advertised Rates: Use loot box expected value calculator tools with confidence intervals to audit claimed drop rates in gacha games, loot boxes, and RNG systems.
- Community Drop Rate Research: Aggregate player data to estimate unknown drop rates. Our game drop rate statistics calculator provides crowdsourced estimates with confidence bounds.
- Patch Change Detection: Compare pre-patch vs post-patch drop rates using confidence intervals to detect stealth nerfs/buffs. If intervals don't overlap, change is statistically significant.
- Personal Luck Assessment: Calculate confidence intervals on your personal farming data to see if you're genuinely unlucky or within normal variance.
Practical Drought Analysis Workflow: Step-by-Step RNG Loot Calculator Tool Usage
Here's a reproducible workflow for analyzing droughts using loot calculator online free tools and binomial probability mathematics. This process works for Diablo 4 drop rates by difficulty, Path of Exile 2 rarity drop calculator tool, Minecraft loot table calculator probability, Elden Ring drop rate calculator farming, and any loot-based system.
→ Step 1: Define Drop Parameters for Drop Chance Calculator
Essential Parameters for Accurate Drop Rate Probability Calculation
- Advertised Drop Rate (p): Official or community-estimated probability (e.g., 0.015 for 1.5%)
- Number of Trials (n): Your total attempts/runs/pulls (must be independent trials)
- Observed Successes (k): Actual drops you received (often 0 during droughts)
- Pity System Details: If applicable (gacha games, Lost Ark honing), document pity mechanics—standard binomial doesn't apply
→ Step 2: Calculate Drought Probability Using Binomial Probability Drop Calculator
Use the binomial formula to calculate P(getting k or fewer drops in n trials). For droughts, k=0 simplifies to:
Simplified Drought Probability Formula (Zero Successes)
This is the cumulative failure probability—the chance of getting zero successes across all n independent trials.
Using Online Loot Drop Calculator Tools for Binomial Calculations
Manual binomial calculation for large n is tedious. Use our probability calculator for rare drops tools or scientific calculators:
- LootCalc Drought Analyzer: Input drop rate + trials → instant drought probability with confidence intervals
- Binomial Calculator (Online): Free statistical tools like Stat Trek, Calculator.net provide binomial CDF calculations
- Python/R Scripts: Use scipy.stats.binom or R's pbinom() functions for programmatic analysis
→ Step 3: Interpret Results Against Statistical Thresholds
Drought Probability Interpretation Decision Tree
- P(drought) > 0.25 (25%+): Completely normal variance. Bad luck, but statistically common. Keep farming.
- P(drought) = 0.05 to 0.25 (5-25%): Unlucky but not abnormal. Happens to many players. Consider variance in your planning.
- P(drought) = 0.01 to 0.05 (1-5%): Statistically unusual. Verify you're farming correct content, difficulty, meeting prerequisites.
- P(drought) < 0.01 (1%): Highly abnormal. Check drop rate sources, suspected stealth nerfs, game bugs, or incorrect assumptions about mechanics.
Real-World Examples Across Popular Games
Example: Destiny 2 Raid Exotic Drop Rate Calculator
Scenario: 50 Vex Mythoclast runs, 0 drops, 5% advertised rate
Calculation: P(0 in 50) = (0.95)^50 = 7.69%
Verdict: Unlucky but not abnormal. Within normal variance range.
Example: Honkai Star Rail Warp Calculator Pity System
Scenario: 85 pulls, no 5-star (before hard pity at 90)
Calculation: Requires modified binomial accounting for soft pity increase from 73+ pulls
Verdict: Use dedicated pity system calculator tools—standard binomial underestimates probability.
Example: Borderlands 3 Dedicated Drop Calculator
Scenario: 200 boss kills, 0 legendary (10% advertised)
Calculation: P(0 in 200) = (0.9)^200 = 0.000000002 ≈ 0%
Verdict: Extremely abnormal (<0.001%). Verify you're on Mayhem mode, farming correct boss, not using loot filter.
Advanced Drought Analysis: Pity Systems, Cumulative Drop Rate, and Farming Efficiency Calculator
→ Pity System Calculator: Modified Binomial for Gacha Probability Calculator
Standard binomial assumes constant drop rate p across all trials. Pity systems violate this assumption—drop rates increase after consecutive failures. Genshin Impact soft pity calculator, Honkai Star Rail pity tracker, and gacha spark calculator tools require modified probability models. Our pity verification guide covers advanced pity mathematics.
Soft Pity Modeling: Incremental Rate Increase Calculations
Genshin Impact increases 5-star rate from 0.6% to ~33% between pulls 74-90 (soft pity). Calculating drought probability requires summing probabilities across rate tiers:
Piecewise Pity Probability Formula (Simplified)
Each soft pity pull has unique increasing rate. Our gacha pull simulator with rates tools model exact soft pity curves for accurate calculations.
→ Cumulative Drop Rate Calculator: Expected Value Loot Calculator Integration
Cumulative drop rate (probability of at least one success) complements drought analysis. Use the union probability formula covered in our calculator mathematics guide:
This answers "What's my chance of getting the drop in n attempts?" Essential for session planning with our farming efficiency calculator tools.
Variance and Bankroll Management: High-Variance Loot System Calculator
Droughts create variance—outcome volatility around expected value. High variance requires larger bankrolls to survive dry streaks. Our variance guide and POE Stacked Deck variance analysis provide detailed risk management frameworks using binomial-derived variance calculations.
Multiple Loot Sources: Loot Distribution System Calculator for MMORPG
When farming multiple drop sources simultaneously (e.g., MMORPG loot distribution calculator DKP systems, final fantasy XIV loot distribution calculator raid splits), use multinomial distribution—the multivariate extension of binomial. Our game economy calculator API handles complex multi-source probability modeling.
FAQ: Drought Analysis, Binomial Probability & Confidence Intervals
At what point should I suspect my drought is abnormal, not just bad RNG?
Use the p < 0.05 threshold: if P(drought) < 5%, your drought is statistically unusual. For a 1% drop rate, this occurs around 300 failures. For 0.1% drop, around 3,000 failures. Below 1% probability, investigate drop rate accuracy, farming requirements, or game bugs. Our drop rate calculator tool calculates exact thresholds.
What's the difference between binomial probability and confidence intervals?
Binomial probability: "Given known drop rate p, what's the chance of my observed results?" (forward probability). Confidence intervals: "Given observed results, what's the likely true drop rate range?" (inverse inference). Use binomial for drought analysis with known rates; use confidence intervals for verifying unknown/disputed rates.
How do I calculate drought probability for gacha games with pity systems?
Standard binomial underestimates success probability with pity (assumes constant rate). Use specialized pity system calculators that model soft pity rate increases. For Genshin Impact pity calculator gacha or Honkai Star Rail warp calculator pity system, see our pity verification guide.
I got 0 drops in 20 trials with 5% drop rate. Is this abnormal?
No. P(0 in 20) = (0.95)^20 = 35.8%—more than 1 in 3 players experience this. Small sample sizes have massive variance. Don't conclude anything from <100 trials for typical drop rates. Use our probability calculator for gaming drops to avoid small-sample fallacies.
Why are my confidence intervals so wide with only 100 samples?
Sample size determines precision. Small samples produce wide confidence intervals (low precision). For narrow intervals, you need thousands of trials—especially for low drop rates. 100 trials with 1% drop rate gives ±2% margin of error (useless). 10,000 trials gives ±0.2% (useful). See our sample size requirements section above.
How do I analyze droughts when farming multiple items simultaneously?
For any specific item, use standard binomial with that item's individual drop rate. For "at least one of several items", sum individual drop probabilities (if mutually exclusive) or use inclusion-exclusion principle. Our loot table calculator online tools handle multi-item probability automatically.
Conclusion: Transform Frustration into Statistical Certainty with Drop Rate Calculator Tools
Droughts are inevitable in loot-based games—but binomial probability distribution and confidence interval analysis transform subjective frustration into objective statistical assessment. By understanding these mathematical frameworks and using loot calculator online free tools, you gain the power to answer definitively: "Is my drought normal variance, or statistically abnormal?"
Whether you're analyzing Diablo 4 loot calculator drop rate formula farming sessions, Path of Exile currency drop calculator reddit discussions, Genshin wish calculator with history tracking, Lost Ark honing calculator probability optimization, or Destiny 2 raid loot drop calculator reddit debates—the underlying mathematics remains constant. Calculate P(drought) using binomial formulas, compare against statistical thresholds (5% significance level), verify advertised rates with confidence intervals, and make informed decisions backed by rigorous probability theory.
The next time you face an extended dry streak, don't rage-quit or blame RNG blindly. Open our drop rate calculator gaming probability tools, input your parameters, calculate exact drought probability, and let mathematics guide your interpretation. If P(drought) > 25%, it's normal—keep farming. If P(drought) < 1%, investigate further. Data-driven farming replaces emotional decision-making with statistical certainty.
Explore our game-specific calculators for Minecraft loot table calculator probability, Warframe relic drop chance calculator, Elden Ring item drop rate calculator farming, Apex legends loot tick calculator heirloom, and dozens more. Read our methodology for validation processes, and join the community of mathematically-informed gamers who've mastered probability theory. Your droughts don't control you—mathematics does.
Related Reading
- Calculator Explained: Behind the Math | EV, GPH & Drop Rates — Mathematical foundations powering loot calculators
- Drop Math: EV, Union Probability & Binomial Distribution — Comprehensive binomial probability guide with examples
- Understanding Variance in Loot-Based Games — Why dry streaks happen and variance management strategies
- Independent Trials & Pity System Verification — Advanced pity system mathematics for gacha games
- Drop Rate Math: EV vs GPH vs Variance Complete Guide — Unified probability mathematics for drop rate optimization
- Top 10 Drop Rate Calculation Mistakes Players Make — Common probability errors and how to avoid them
- Diablo 4 Loot Calculators: Drop Rates & EV Tools — Apply binomial analysis to Diablo 4 farming
- Path of Exile Currency Calculator & Drop Rate Tools — POE-specific probability calculators and variance analysis
- OSRS Barrows Calculator: EV & Unique Drop Rates — Confidence intervals for Barrows drop rate estimation
- Our Methodology: Data Sources & Validation — How LootCalc ensures drop rate accuracy and statistical rigor