Diablo 4 Helltide Guide: EV, Routes, Chest Mixes & Real Efficiency
This guide explains Helltide with math you can reproduce: how chest costs translate into chests per hour, how expected value (EV) differs from gold per hour (GPH), how to tune your cinders/hour pacing, and how to pick a Mystery vs Regular chest mix that fits your route. We link directly to the interactive Helltide Loot Calculator so you can plug in your numbers.

How Helltide Math Works
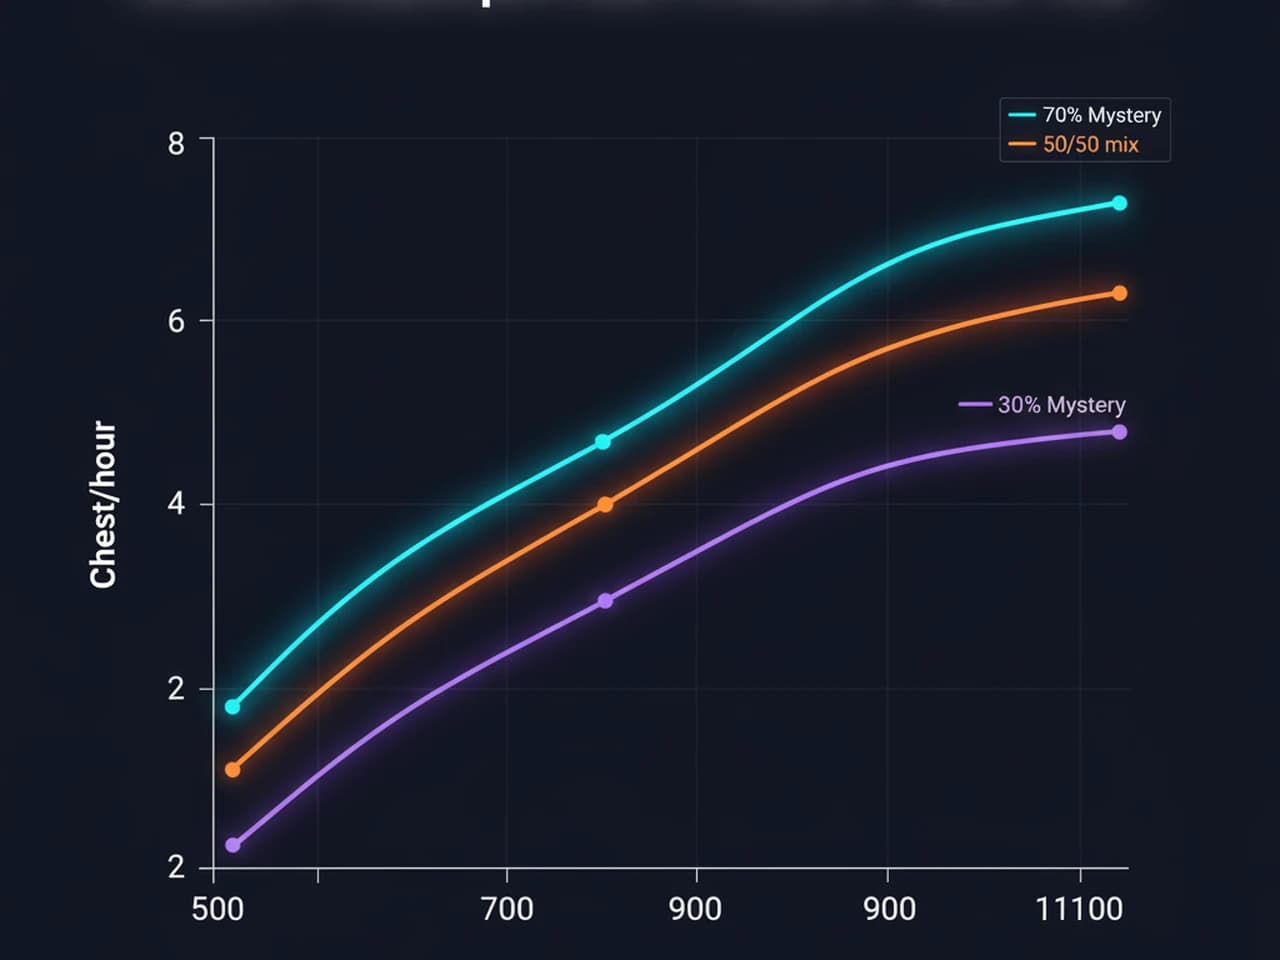
Helltide is a cost–mix model. Every chest costs cinders; Mystery chests cost more but are often valued higher, while Regular chests cost less and stabilize throughput. The three core quantities are: (1) average cost per chest, (2) chests per hour, and (3) EV per hour.
→ Core formulas you can verify
Average cost per chest
Let m be the share of Mystery chests (0–1). With costs 250 (Mystery) and 75 (Regular), the average cost is:
avg_cost = 250 × m + 75 × (1 − m)Chests per hour
If your pacing is C cinders/hour, then:
chests_per_hour = floor(C ÷ avg_cost)EV per hour vs EV per chest
EV per chest is value per action and is time-neutral. EV/hour is efficiency and depends on throughput:
EV/hour = EV_per_chest × chests_per_hourWhy EV can go up while GPH goes down
If you raise EV per chest by adding long detours, your throughput may drop enough that EV/hour falls. That is the central trade-off: value per action vs time.
💡Worked example (plug these into the calculator)
Suppose C = 900 cinders/hour and you open m = 0.70 Mystery. Then avg_cost = 0.7×250 + 0.3×75 = 197.5, so chests/hour ≈ floor(900 ÷ 197.5) = 4. If your EV per chest is 126k, then EV/hour ≈ 504k.
Where EV per chest comes from
EV is a weighted average of outcomes. See our weighted average and expected value entries, plus the calculator's Methodology section.
Route Planning & Cinders Pacing
Two factors dominate your hourly results: time lost between chests and density of cinders opportunities. Your goal is to maintain a steady cinders/hour while minimizing dead travel.
→ Quantify your time, don't guess
Measure per-chest travel time
Track a 10–15 minute session and record: (1) total chests opened, (2) start–end cinders, (3) elapsed time. Derive average travel seconds per chest and your cinders/hour. Then enter these in the calculator.
Don't ignore variance
Sessions fluctuate. Evaluate not only mean results but also your "bad" quantiles. See quantile and dry streak.
Useful rule of thumb
If a new detour adds >20–25% travel time, its EV per chest must be exceptionally higher to improve EV/hour. Otherwise it's just "shiny but slower."
Confidence grows with samples
For reliable conclusions, log multiple sessions and use a simple 95% CI (see confidence interval) to understand the spread of hourly results.
Choosing a Mystery vs Regular Mix
The share of Mystery determines your average cost and changes your throughput. Use mixes as a lever to balance cinders pacing with your route density.
→ Mixes and the cost–throughput trade-off
High-Mystery mixes
Pros: higher EV per chest, potential for jackpots.
Cons: low throughput if cinders/hour is limited; more variance.
Lower-Mystery mixes
Pros: more chests/hour, smoother results.
Cons: slightly lower EV per chest. This can still win on EV/hour.
Use data, not vibes
Try 70-30, 50-50, and 30-70 mixes with your measured cinders pacing. Keep the one that yields the best EV/hour—not the one that "feels" lucky.
Variance and psychology
Mystery's variance includes long lucky and dry runs. Plan for the worst tails, not only the screenshot highs. See variance.
Route Comparison: Example Table
Replace the placeholder values below with your own. Record at least two sessions per route before drawing conclusions.
| Route | Mix (Mystery%) | Cinders/hr | Avg cost | Chests/hr | EV/chest | EV/hr |
|---|---|---|---|---|---|---|
| A (densest) | 70% | 900 | 197.5 | 4 | 126k | 504k |
| B (safer) | 50% | 820 | 162.5 | 5 | 110k | 550k ⭐ |
| C (long detours) | 80% | 760 | 220.0 | 3 | 140k | 420k |
→ Interpreting the table
Throughput beats spikes
Route B wins because the mid EV per chest is offset by higher throughput. Helltide rewards stable routes.
What to improve next
On Route C, reduce detours or drop Mystery share. Aim to push chests/hour back up without tanking EV/chest.
Keep a change log
When you alter a mix or segment, log the time and reason. That history turns into your best playbook.
Shareable setups
The calculator will soon expose a share link so your inputs are encoded in the URL. Save your best runs and compare apples to apples.
Target Farming & Variance Management
If you hunt specifics, expect volatility. Apply union probability and binomial math to set rational goals.
→ At least one success over many runs
For per-run success probability p over n independent runs, the chance of "any success" is:
P(any) = 1 − (1 − p)^nDon't over-interpret short streaks
Dry streaks happen even with fair odds. Plan bankroll and time around bad tails, not average outcomes.
Track quantiles, not only means
A "P10" session might be 30–40% below your mean EV/hour. If that's unacceptable, change route or mix.
Related reading
See binomial distribution and union probability.
FAQ
Q: Is EV/chest always higher with Mystery?
Often, yes—but Mystery reduces throughput and increases variance. Let data decide via EV/hour, not feelings.
Q: Why did my EV/hour drop after "optimizing"?
You likely increased detours chasing higher EV/chest. If chests/hour falls more than EV/chest rises, EV/hour declines. Re-measure travel time and rebalance mix.
Q: How many sessions should I log?
Start with 3–5 sessions per candidate route, then keep logging. Use rough CIs to gauge stability and decide when a route is truly better.