Drop Rate Mathematics in Gaming: Probability Calculator Guide 2025
Master the mathematical foundations of drop rate calculations in gaming. This comprehensive guide covers probability formulas, binomial distributions, expected value analysis, cumulative drop rate calculations, and confidence intervals—complete with practical calculator tools and reproducible formulas for optimizing your farming efficiency across all loot-based games.

Drop rate mathematics forms the foundation of efficient farming in every loot-based game—from Diablo 4 and Path of Exile to Old School RuneScape and gacha games. Whether you're calculating cumulative success probability for rare drops, using a drop rate calculator gaming probability tool, or analyzing expected value per hour, understanding the underlying probability formulas transforms guesswork into data-driven optimization. This guide, validated through our rigorous statistical methodology, provides reproducible formulas and practical workflows for mastering game drop chance calculations, binomial probability modeling, and confidence interval estimation—the same mathematics powering professional farming communities and optimization tools like LootCalc.
Drop Rate Probability Essentials: Key Formulas 2025
How to Calculate Drop Rates in Games: Foundation Formulas
Understanding how to calculate drop rates in games begins with three fundamental concepts: single-trial probability, expected value, and cumulative success probability. These formulas apply universally across all loot-based games, from MMORPGs to gacha systems, and form the foundation for every advanced drop rate calculator tool.
→ Game Drop Chance Formula: Single-Trial Probability
The most basic game drop chance formula expresses probability as a decimal or percentage. If an item has a 1/128 drop rate (like OSRS Dragon Warhammer from Shamans), the single-trial probability is p = 1/128 = 0.0078125 = 0.78125%. This represents your chance per individual kill or chest opening. However, most players need to know: "What's my chance of getting this drop in 100 kills?" That requires cumulative probability calculation.
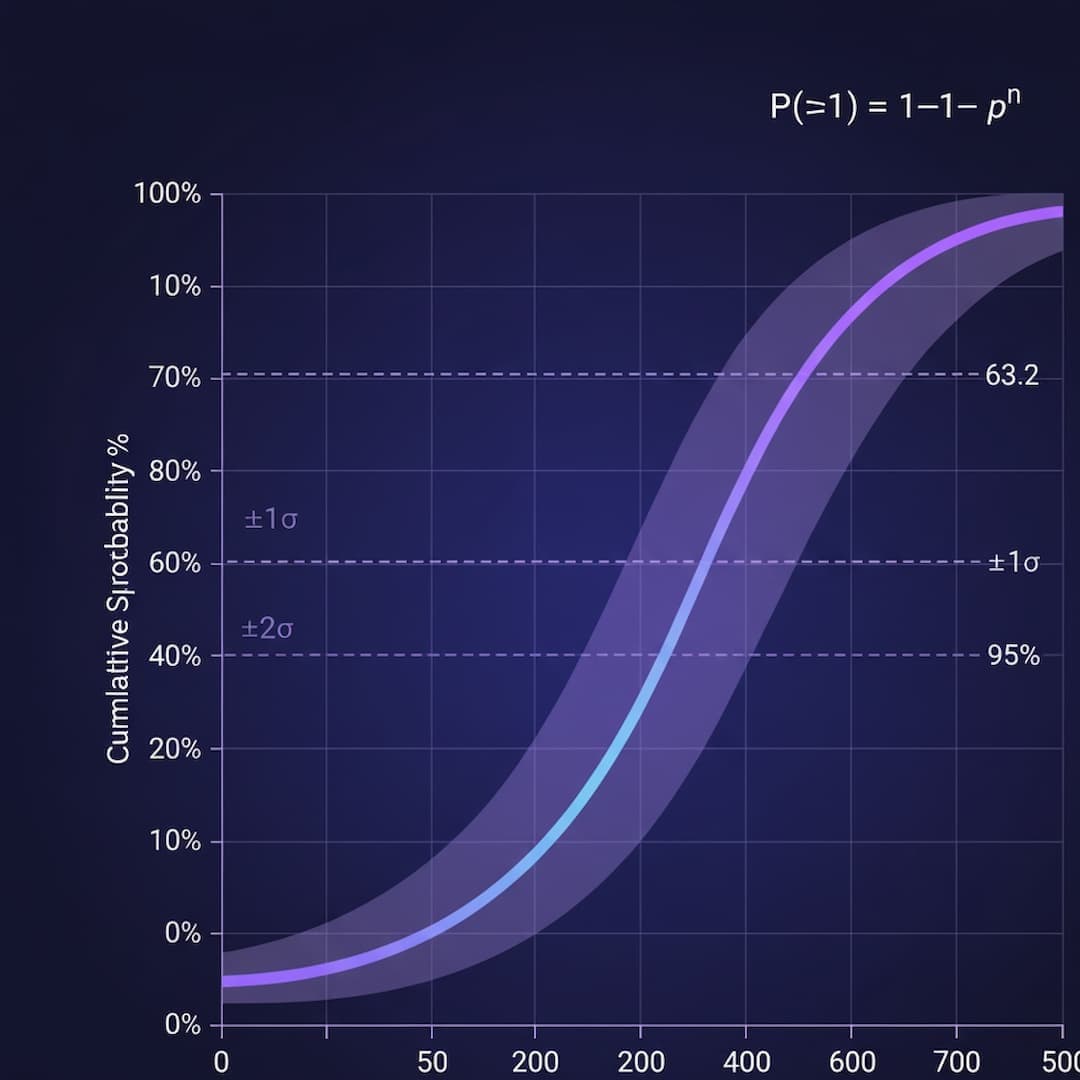
Cumulative Drop Rate Calculator: The Complement Rule
- •p = single-trial drop rate (e.g., 0.01 for 1% drop)
- •n = number of attempts (kills, chests, rolls)
- •(1-p)^n = probability of failing all n attempts
- •1 - (failure probability) = success probability
Practical Example: OSRS Dragon Warhammer Drop Rate
For a 1/5000 drop rate (like OSRS Corporeal Beast Sigil), calculating your success probability over 1000 kills:
n = 1000 kills
P(≥1 drop) = 1 - (1 - 0.0002)^1000
P(≥1 drop) = 1 - (0.9998)^1000
P(≥1 drop) = 1 - 0.8187
P(≥1 drop) = 0.1813 = 18.13%
This reveals a critical insight: even after 1000 kills on a 1/5000 drop, you only have an 18% chance of success—far from guaranteed. Use our drop rate probability calculator to compute this instantly for any drop rate and kill count.
→ Expected Value Loot Calculator: Valuing Reward Tables
An expected value loot calculator determines the average value per attempt by summing all possible rewards weighted by their probabilities. This formula is essential for comparing farming routes and optimizing gold per hour.
Expected Value Formula: Weighted Probability Sum
For a loot table with multiple drops:
| Drop | Value | Probability | Contribution |
|---|---|---|---|
| Rare drop | 50M gold | 1/5000 (0.0002) | 10,000 |
| Uncommon drop | 500K gold | 1/100 (0.01) | 5,000 |
| Common drop | 10K gold | 1/10 (0.1) | 1,000 |
| Total Expected Value | 16,000 gold | ||
This boss averages 16,000 gold per kill when accounting for all drop probabilities. If kills take 2 minutes, that's 480,000 gold/hour.
Converting EV to Gold Per Hour (GPH)
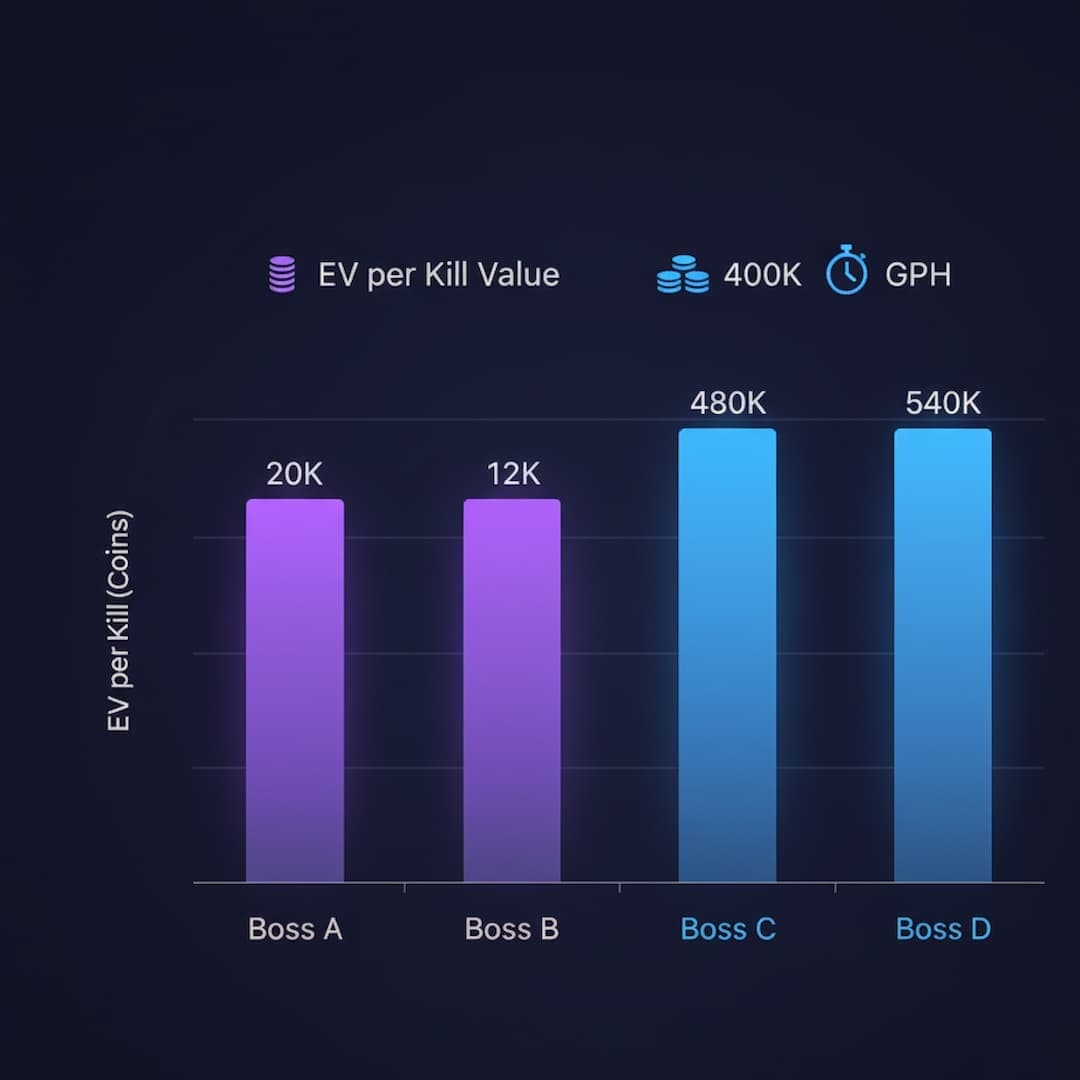
Expected value alone doesn't account for time investment. Converting to gold per hour (GPH) requires dividing EV by kill time: GPH = (EV per kill / kill_time_minutes) × 60. A boss with 20K EV per kill at 3 minutes per kill yields 400K GPH, while a boss with 15K EV at 1.5 minutes yields 600K GPH—making the second boss more efficient despite lower EV. Learn more in our EV vs GPH optimization guide.

Binomial Probability Drop Calculator: Distribution Modeling
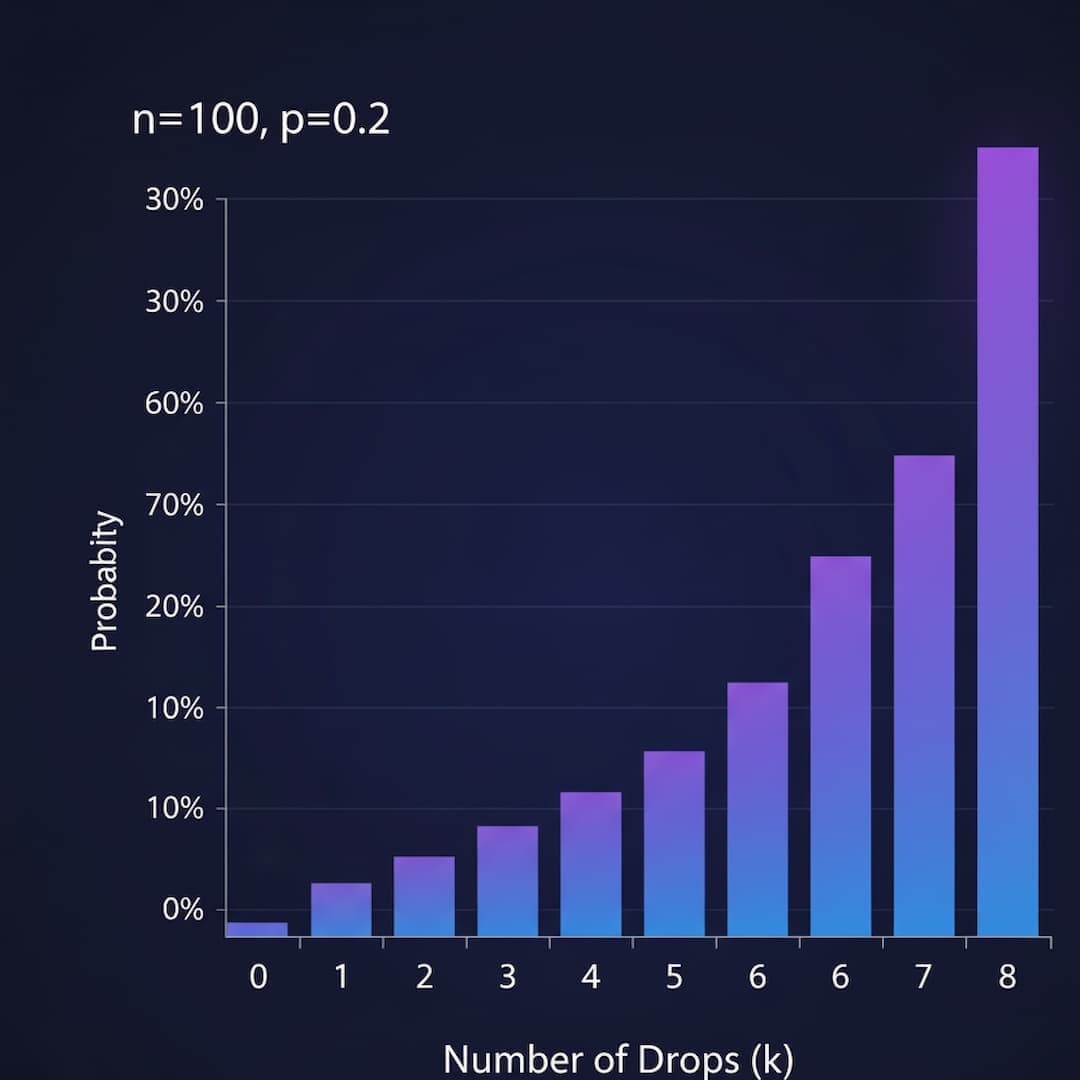
While cumulative probability answers "What's my chance of at least one success?", a binomial probability drop calculator answers "What's my chance of exactly k successes?" or "What's the probability distribution of outcomes?" This is critical for understanding variance, planning inventory space, and modeling pity systems.
→ Binomial Distribution Formula for Drop Rates
The binomial probability formula calculates the probability of exactly k successes in n independent trials, each with success probability p:
Binomial Probability Formula Components
- •C(n, k) = n! / (k! × (n-k)!) = number of ways to arrange k successes in n trials
- •p^k = probability of k successes
- •(1-p)^(n-k) = probability of (n-k) failures
- •X = random variable representing number of successes
Practical Example: Probability of Exactly 2 Drops in 100 Kills
For a 1/50 drop rate (2% chance), what's the probability of getting exactly 2 drops in 100 kills?
C(100, 2) = 100!/(2! × 98!) = 4,950
P(X = 2) = 4,950 × (0.02)^2 × (0.98)^98
P(X = 2) = 4,950 × 0.0004 × 0.1326
P(X = 2) = 0.2734 = 27.34%
This means there's a 27% chance of getting exactly 2 drops in 100 kills. The full distribution shows the probability for 0, 1, 2, 3... drops, revealing that while 2 drops is the expected value (100 × 0.02 = 2), the most likely outcome is actually getting 1 or 2 drops with significant variance.
Mean, Variance & Standard Deviation in Drop Rate Analysis
Binomial distributions have predictable statistical properties:
- Mean (expected value): μ = n × p (100 kills × 0.02 = 2 expected drops)
- Variance: σ² = n × p × (1-p) (100 × 0.02 × 0.98 = 1.96)
- Standard deviation: σ = √(n × p × (1-p)) = √1.96 = 1.4 drops
The standard deviation of 1.4 drops tells us that in 100 kills, we'll typically get between 0.6 to 3.4 drops (±1σ from mean), and 95% of players will get between -0.8 to 4.8 drops (±2σ). This variance analysis is critical for understanding dry streaks and lucky streaks—both are normal statistical outcomes, not rigged RNG. Learn more in our comprehensive variance guide.

→ Probability Calculator for Rare Drops: Reddit-Validated Methods
Communities like r/2007scape, r/pathofexile, and r/Diablo frequently discuss drop rate calculations. The most commonly requested drop rate calculator gaming probability tool reddit features include:
- Cumulative probability calculator: "What's my chance after X kills?" (uses complement rule)
- Dry streak calculator: "What percentile am I in if I've gone Y kills dry?" (uses CDF)
- Multiple drop calculator: "What's my chance of getting 2+ drops?" (uses binomial sum)
- Union probability for multiple tables: "What's my chance of ANY rare from multiple sources?" (inclusion-exclusion principle)
All these calculations are available in LootCalc's probability calculator suite, with shareable URLs for Reddit posts and Discord discussions. The formulas are validated against community-verified drop rates from OSRS Wiki, PoE Wiki, and Diablo 4 drop rate databases.
Union Probability for Multiple Independent Drop Tables
When farming multiple drop sources (e.g., OSRS Barrows with 6 different rare items), calculate the probability of at least one success from any source using the inclusion-exclusion principle. For small probabilities, the approximation P(any) ≈ 1 - Π(1 - p_i) is accurate. For example, if you have 6 independent 1/100 drops, the union probability is approximately 5.85%, not 6%. See our union probability guide for detailed formulas.
Drop Rate Confidence Interval Calculator: Statistical Validation
A drop rate confidence interval calculator helps players estimate true drop rates from observed data and determine if their results fall within expected variance or suggest something unusual (like undisclosed pity systems or incorrect wiki rates). This is essential for crowdsourced drop rate validation and detecting stealth nerfs/buffs.
→ Sample Size Calculation for Accurate Drop Rate Estimation
Before estimating a drop rate, determine how many samples you need for a given precision level. The formula for required sample size at 95% confidence is:
Confidence Interval Sample Size Formula
- •z = 1.96 for 95% confidence (2.576 for 99% confidence)
- •p = estimated drop rate (use 0.5 for maximum variance if unknown)
- •E = desired margin of error (e.g., 0.01 for ±1% precision)
Example: Estimating a 1% Drop Rate with ±0.2% Precision
To estimate a 1% drop rate (p = 0.01) with ±0.2% margin of error (E = 0.002) at 95% confidence:
n ≥ (3.8416 × 0.0099) / 0.000004
n ≥ 0.0380 / 0.000004
n ≥ 9,508 kills
This means you need approximately 9,500 kills to estimate a 1% drop rate within ±0.2% margin of error. For rarer drops (1/1000), you'd need proportionally more kills. This formula is critical for crowdsourced drop rate research projects that aggregate community data to validate wiki rates.
→ Constructing Confidence Intervals from Observed Data
After collecting data, construct a confidence interval to estimate the true drop rate. For large samples (n > 30 and np > 5), use the normal approximation:
95% Confidence Interval Formula for Drop Rates
- •p̂ = observed drop rate (successes / total_trials)
- •z = 1.96 for 95% CI
- •√(p̂ × (1 - p̂) / n) = standard error
If you observe 48 drops in 5000 kills: p̂ = 0.0096, CI = 0.0096 ± 1.96 × √(0.0096 × 0.9904 / 5000) = 0.0096 ± 0.0027 = [0.69%, 1.23%]
Detecting Drop Rate Changes & Stealth Nerfs
Confidence intervals enable statistical hypothesis testing. If a wiki claims 1% drop rate but your 95% CI is [0.4%, 0.8%] based on 10,000 kills, this suggests either: (1) extraordinary bad luck (<5% probability), (2) incorrect wiki rate, or (3) stealth nerf. Community-aggregated data resolves this—if 100 players all observe similar downward deviations, it's strong evidence of a rate change. This methodology was used to detect OSRS Zulrah drop table nerfs and Path of Exile stealth Divine Orb rate changes.

→ Advanced Drop Rate Calculator Features for 2025
Modern drop rate calculators incorporate multiple advanced features beyond basic probability:
- Pity system modeling: Accounts for bad luck protection (e.g., Genshin Impact 90-pull pity)
- Dynamic drop rates: Handles increasing probabilities per attempt (e.g., FFXIV raid mounts)
- Multi-table union probability: Calculates success chance across multiple independent sources
- Time-normalized EV/GPH: Converts drop rates to gold/hour accounting for kill speed
- Variance analysis: Displays probability distribution, standard deviation, and percentiles
- Shareable URLs: Encode all inputs in URL for Reddit/Discord discussions
LootCalc implements all these features with transparent, reproducible formulas validated against academic probability theory. Every calculation includes methodology documentation and references to our probability glossary for self-verification.
FAQ: Drop Rate Mathematics & Probability Calculators
What's the difference between cumulative probability and binomial probability?
Cumulative probability (P(≥1 success) = 1 - (1-p)^n) answers "What's my chance of getting at least one drop?" Binomial probability (P(X=k) using binomial formula) answers "What's my chance of exactly k drops?" Cumulative is a special case of binomial where you sum all outcomes from k=1 to k=n. Use cumulative for "Will I get the drop?" questions and binomial for full distribution analysis or "exactly k drops" scenarios.
How many kills do I need to accurately estimate a drop rate?
For 95% confidence and ±20% relative margin (e.g., estimating 1% as 0.8-1.2%), you need approximately n ≈ 384 / p kills where p is the drop rate. For 1% drop (1/100), that's ~38,400 kills. For 10% drop (1/10), ~3,840 kills. Halving the margin (±10% relative) requires 4x the sample. Community crowdsourcing aggregates data to reach these thresholds faster.
How do I convert expected value (EV) to gold per hour (GPH)?
Formula: GPH = (EV_per_action / time_per_action_minutes) × 60. If a boss has 50K EV per kill and takes 4 minutes: GPH = (50,000 / 4) × 60 = 750,000 gold/hour. For routes with travel time, use: GPH = (total_EV / (action_time + travel_time + downtime)) × 60. Our EV vs GPH guide covers advanced optimizations.
What's the probability of going dry for X attempts on a 1/Y drop?
Formula: P(zero drops in n attempts) = (1 - 1/Y)^n. For 1/100 drop over 200 kills: (0.99)^200 = 0.134 = 13.4% chance of zero drops. Going twice the drop rate (200 kills on 1/100) dry happens to ~13% of players—uncommon but not suspicious. Going 5x the rate (500 on 1/100) has only 0.66% probability—rare enough to warrant checking wiki rates or RNG integrity.
How do I calculate drop rates with pity systems (guaranteed drop after X attempts)?
For hard pity (guaranteed at exactly X), use: P(drop by attempt n) = 1 if n ≥ X, else use normal cumulative formula. For soft pity (increasing rate), model with piecewise function: standard rate until threshold, then increased rate. Genshin Impact 90-pull hard pity with 1.6% base rate requires simulation or hybrid calculation. See our pity system verification guide for detailed methods.
What's the best drop rate calculator tool for Reddit discussions?
LootCalc offers shareable URLs that encode all inputs, making it ideal for r/2007scape, r/pathofexile, r/Diablo discussions. Enter your drop rate and kill count, copy the URL, and share—recipients see your exact scenario. Features include cumulative probability, binomial distribution, confidence intervals, multi-table union probability, and EV/GPH calculations with transparent formulas. All calculations are methodology-documented for academic verification.
Conclusion: Mastering Drop Rate Mathematics for Optimal Farming
Understanding drop rate mathematics—from basic cumulative probability formulas to advanced binomial distributions and confidence interval estimation—transforms random farming into optimized, data-driven progression. Whether you're using a drop rate calculator gaming probability tool for OSRS grinds, calculating expected value per hour for Diablo 4 Helltide routes, or validating wiki drop rates through statistical sampling, these reproducible formulas provide the foundation for every efficiency decision.
The mathematics revealed in this guide—complement rule for cumulative probability, binomial probability for distribution modeling, EV summation for reward valuation, and confidence interval construction for rate estimation—apply universally across all loot-based games. Start applying these principles today: calculate your cumulative success probability for current grinds, convert boss EV to GPH for route comparison, analyze your dry streak percentile using binomial CDF, or contribute to community drop rate validation projects with proper statistical methodology.
For interactive calculators implementing every formula in this guide, explore LootCalc's probability calculator suite. For deeper mathematical foundations, read our comprehensive probability guide and calculator methodology documentation. Master the math, optimize your grind, and transform RNG into statistical advantage.
Related Reading
- Calculator Explained: Behind the Math — Deep dive into LootCalc's probability formulas and methodology
- Drop Rate Math: EV, GPH & Variance Guide — Comprehensive guide to expected value and variance analysis
- Drop Math: EV, Union Probability & Binomial — Practical guide with reproducible formulas and workflows
- Understanding Variance in Loot-Based Games — Learn why dry streaks happen and how to manage RNG variance
- Independent Trials & Pity System Verification — Master gacha probability and pity mechanics
- EV vs GPH: Optimize Time in Loot Farming — Convert expected value to time-normalized efficiency
- Top 10 Drop Rate Calculation Mistakes — Avoid common probability errors that cost gold and time
- Our Methodology — How LootCalc validates formulas and ensures statistical accuracy
- Glossary — Definitions for probability, EV, binomial distribution, and more